Recent Economic Situation Due to Tariffs
Recent economic headlines have been dominated by escalating trade tensions and tariffs, significantly impacting global markets and economic stability. The imposition of tariffs, particularly by major economies like the United States, has heightened uncertainty, reduced international trade volumes, and consequently slowed economic growth worldwide. According to the International Monetary Fund (IMF), global trade growth dropped from 5.2% in 2022 to approximately 2.5% in 2023, a clear indicator of rising trade frictions.
These tariffs, originally implemented to protect domestic industries and reduce trade deficits, have inadvertently triggered inflationary pressures. As import prices increase, consumer and producer costs rise, pushing inflation upwards and influencing the broader economic landscape.
Why the US Is Trying to Lower Interest Rates Through Tariffs
An intriguing aspect of the recent tariff strategy is its indirect connection to monetary policy. Rising inflation due to tariffs impacts economic indicators, prompting reactions from the Federal Reserve (Fed). Historically, when tariffs drive up prices, inflation increases, and economic growth slows. Consequently, the Fed may respond by lowering interest rates to stimulate economic activity and prevent recession.
Federal Reserve Chair Jerome Powell noted in a recent congressional testimony:
“Tariffs and trade uncertainty have introduced additional volatility and complexity into the economic outlook, influencing monetary policy decisions significantly.”
Thus, tariffs are not just tools for trade negotiations; they indirectly guide monetary policy, prompting the Fed to reduce interest rates to maintain economic stability.
Clarifying QT, QT Tapering, QE, and QE Tapering
To grasp the impact of monetary policy adjustments, it is essential to understand several terms:
- Quantitative Easing (QE): The Fed’s strategy of buying bonds to inject liquidity into the economy, thus stimulating economic activity.
- QE Tapering: Gradually reducing these bond purchases, signaling a move towards tighter monetary policy.
- Quantitative Tightening (QT): The opposite of QE, QT involves shrinking the Fed’s balance sheet by either selling bonds or allowing them to mature, effectively withdrawing liquidity from the economy.
- QT Tapering: Slowing down the reduction of the balance sheet, signaling a shift towards less restrictive monetary policy and potentially preceding lower interest rates.
The distinction between these terms is critical because each represents a different phase and intention of monetary policy adjustments.
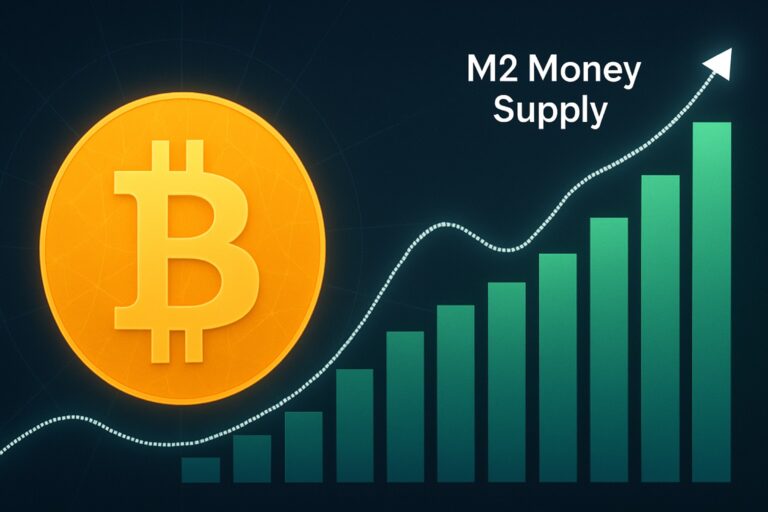
Historical Changes in M2 Money Supply After QT Tapering
Historically, analyzing the M2 money supply—a broad measure encompassing cash, checking deposits, and easily convertible near money—after QT tapering offers valuable insights into monetary policy’s real-world impacts.
For instance, during the QT tapering phase initiated by the Fed in late 2019 and early 2020, a stabilization and eventual slight acceleration in M2 growth were observed. Data from the Federal Reserve highlights this trend clearly:
| Year | QT Tapering Initiation | Annual M2 Growth (%) |
|---|---|---|
| 2018 | Before QT Tapering | 3.9% |
| 2019 | QT Tapering Begins | 6.7% |
| 2020 | Post QT Tapering | 25.8% (pandemic effect) |
| 2021 | Stabilization Period | 13.1% |
This table clearly shows how QT tapering typically precedes a stabilization or slight rise in liquidity. The sharp spike in 2020 is largely pandemic-driven, but the trend of stabilization is evident post-QT tapering.
Graphical Analysis of M2 Post-QT Tapering
Graphically, historical data from the Fed’s database illustrates the impacts of QT tapering vividly. Typically, post-QT tapering periods show a moderation or reversal of tightening conditions. During these times, the M2 curve typically flattens or slightly inclines, indicating easing liquidity conditions. Such patterns were clearly seen after the QT tapering measures in 2019:
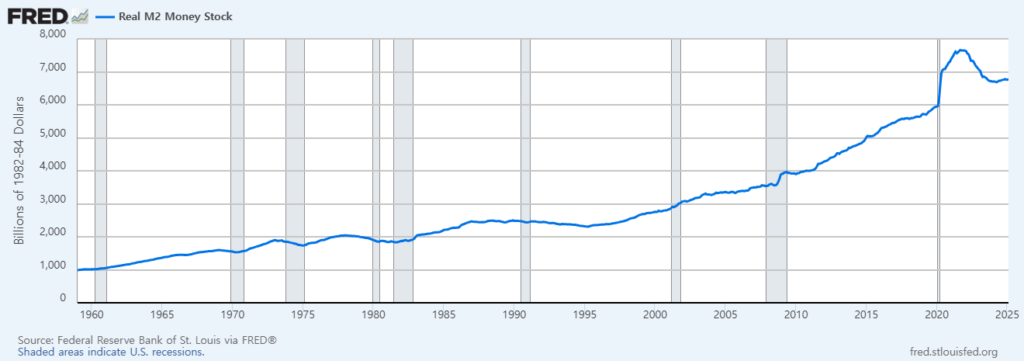
This graphical analysis helps economists and investors predict potential market behaviors and the overall economic outlook.
Implications of QT Tapering on Future Economic Conditions
The subtle yet significant effect of QT tapering on liquidity and monetary supply emphasizes its pivotal role in shaping economic outcomes. Economists closely watch QT tapering signals, interpreting them as indicators of future monetary policy direction. For example, previous QT tapering cycles signaled upcoming rate cuts or more accommodative monetary policy measures, subsequently influencing stock markets, bond yields, and broader economic expectations.
Conclusion and Future Outlook
Understanding the dynamics of M2 money supply post-QT tapering is essential for investors, policymakers, and economists alike. It provides crucial insights into how subtle shifts in monetary policy translate into tangible economic changes. With ongoing trade tensions and the potential for continued adjustments in monetary policy, monitoring M2 trends will remain critically important.